How much power does a solar park generate?
In short: A modern ground-mounted PV plant in Germany generates around 1,000 kWh per kWp per year on a long-term average (source: Fraunhofer ISE). So a 10 MWp plant delivers roughly 10 million kWh per year — on paper, enough electricity for around 3,300 households.
The formula
Annual yield [kWh] = Installed capacity [kWp] × Specific yield [kWh/kWp]
The solar park yield calculator provides a rough self-estimate.
Yield by location
| Region | Specific yield | 10 MWp plant (year) |
|---|---|---|
| Southern Germany | 1,000–1,150 kWh/kWp | 10.0–11.5 GWh |
| Central Germany | 950–1,050 kWh/kWp | 9.5–10.5 GWh |
| Northern Germany | 850–1,000 kWh/kWp | 8.5–10.0 GWh |
Bifacial modules typically add +5–8 % yield, single-axis trackers +10–15 % — see Modules & Trackers.
Yield by plant size — examples
| Plant | Annual yield (average) | Households* |
|---|---|---|
| 5 MWp | approx. 5 GWh | ~1,700 |
| 10 MWp | approx. 10 GWh | ~3,300 |
| 20 MWp | approx. 20 GWh | ~6,700 |
| 50 MWp | approx. 50 GWh | ~16,700 |
| 100 MWp large park | approx. 100 GWh | ~33,000 |
* at 3,000 kWh annual consumption per household (standard value).
What determines the yield
- Global irradiation at the site (south more than north).
- Orientation & mounting (south, east-west, tracker).
- Module technology (mono-Si, bifacial, TOPCon).
- Performance ratio (technical losses — shading, temperature, soiling, cabling losses).
- Weather year (real ±10 % from the average).
What the specific yield really tells you
The central metric for a solar park is the specific yield in kWh per kWp per year. It makes plants of different sizes directly comparable, because it cancels out the installed capacity. A value around 1,000 kWh/kWp counts as a solid German average (Fraunhofer ISE), but the gap between a sun-rich southern German site and a northern German one is several hundred kWh/kWp — not something to wave away. For bank financing this rule of thumb is not enough — there, a site-specific yield forecast based on many years of local irradiation data is the basis, because even small deviations in specific yield add up to substantial revenue differences over the project's lifetime.
It matters to distinguish between kWp (installed module capacity) and the energy actually fed into the grid. Between the two sits the performance ratio, which bundles all technical losses — from temperature and soiling through shading to cabling and inverter losses. A well-planned ground-mounted plant achieves high performance ratios, because unlike a shaded rooftop installation it can be oriented optimally and built unshaded across a large area.
Why solar and wind yield complement each other well
A solar park and a wind farm with similar annual generation have completely different generation profiles. Solar peaks during the day and in the summer half-year, wind is strongest in the winter half-year and also generates at night. This opposing pattern makes combining both technologies — sometimes at the same grid-connection point — attractive for a more even utilisation. Anyone wanting to roughly compare both yields can combine the solar park yield calculator with the wind figures from the guide power yield of a wind turbine; the LCOE calculator provides the economic assessment. Background on the technology is under What is ground-mounted PV.
Frequently asked questions
How reliable is the forecast?
Only ±10–15 % year-to-year variation is robust; multi-year averages are very stable. A site-specific yield forecast based on local irradiation data is the foundation of any bank financing.
What happens after 20 years?
Module degradation is typically 0.5–0.8 % per year — so after 25 years, around 85 % of the initial output remains. The plant keeps delivering, sold directly on the market in post-EEG operation.
How does this relate to the land lease?
With a revenue-based lease, the lease rises with the electricity revenue. Get an advance estimate in the land lease estimator.
Does tracking always mean more yield?
Single-axis trackers typically raise yield by 10–15 %, because the modules follow the sun's path. But the extra yield has to justify the higher investment and maintenance costs and the somewhat larger area requirement — this pays off mainly at irradiation-rich sites with a high share of direct irradiation.
Why is plant size often given in kWp rather than MW?
kWp (kilowatt-peak) denotes the module's rated power under standard test conditions and is the usual reference figure for PV. Because inverters are sometimes sized smaller than the module capacity, the feed-in-side MW figure can be slightly lower — but by convention, the specific yield always refers to the kWp.
Why inverters are sized smaller (DC/AC ratio)
In practice, a solar park's inverter capacity is usually sized lower than the installed module capacity — a DC/AC ratio of roughly 1.1 to 1.3 is common. The reason: the module's rated power is only ever reached under ideal conditions (specific irradiance, defined cell temperature), which in real operation happens rarely and only briefly. A slightly undersized inverter merely clips the rare generation peaks, while passing the full module output through unhindered for most of the year. This so-called clipping costs only a very small share of the annual yield, but noticeably lowers investment costs for the inverter and grid-connection equipment — a standard trade-off in project design that should be kept in mind when interpreting kWp and MW figures.
Yield, self-consumption and direct marketing
The pure yield figure in kWh says nothing yet about how the generated electricity is monetised. A solar park can be remunerated via an EEG auction, sold directly to an offtaker under a long-term power purchase agreement (PPA), or marketed on the spot market via other direct-marketing routes — each with a different revenue profile per kWh generated. Solar power is concentrated around midday and in the summer half-year, when many plants feed in simultaneously on sun-rich days; this can depress achievable market prices in those windows (the so-called cannibalisation effect). Anyone wanting to combine the pure kWh yield forecast with a realistic revenue estimate should therefore also consult the economics metric in the LCOE calculator, which weighs investment and operating costs against yield over the entire lifetime.
Why the annual distribution fluctuates so strongly
Unlike wind, where generation is relatively evenly spread across the year, solar yield concentrates heavily on the summer months. In Germany, a substantial share of the annual yield falls in the months April to September, while only a small fraction of annual production occurs in the winter months. For grid planning and storage concepts this seasonality is a key constraint: a battery storage system at the same grid-connection point can smooth daily peaks, but cannot offset the fundamental winter-summer imbalance of solar generation — combining it with wind power at the same site is better suited to that.
How much does the yield vary from month to month?
The peak summer months deliver a multiple of the weakest winter months — on sun-poor winter days, daily generation can be close to zero. Over the full year, this evens out across the twelve months to the specific annual yield stated above.
Does climate change affect the yield?
According to Fraunhofer ISE, long-term series of global irradiation in Germany show a slightly positive trend over several decades, but one considerably smaller than the year-to-year variation driven by weather patterns. For individual project yield forecasts, this long-term trend is less relevant than the local, long-term irradiation statistics.
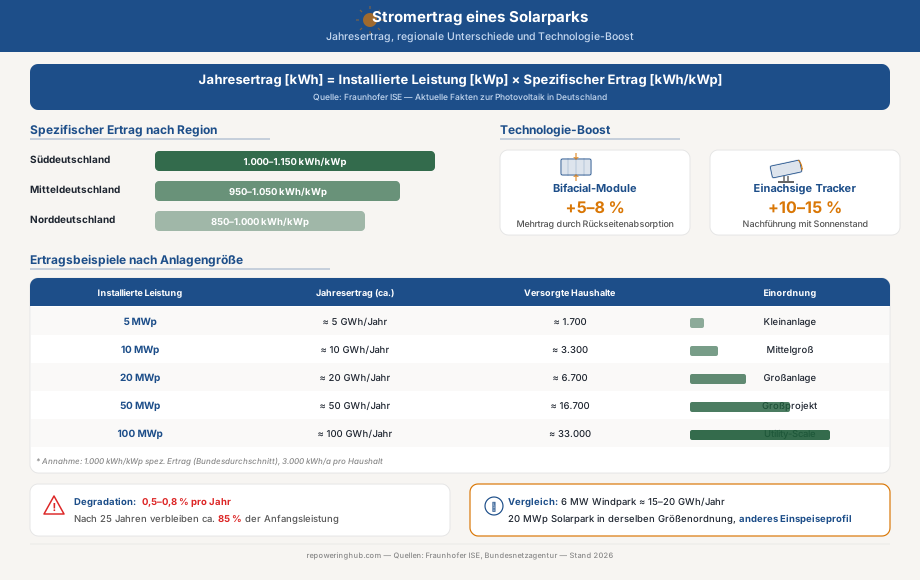
Solar park power yield – Regional yields, plant sizes and technology boosters