How Much Power Does a Wind Turbine Produce?
In short: A modern 6 MW onshore turbine produces 15–20 million kWh per year depending on site — enough for roughly 5,000–7,000 households. The exact figure depends on rated power and full-load hours.
The simple formula
Annual yield [kWh] = rated power [kW] × full-load hours [h/year]
Example: 6,000 kW × 3,000 full-load hours = 18,000,000 kWh/year = 18 GWh.
Yield by turbine size
| Turbine | Full-load hours | Annual yield | Households* |
|---|---|---|---|
| Legacy turbine 1.5 MW | 1,900 h | 2.9 GWh | ~1,000 |
| Modern 3 MW | 2,800 h | 8.4 GWh | ~3,000 |
| Modern 6 MW | 3,000 h | 18.0 GWh | ~6,000 |
| 6 MW prime coastal site | 3,800 h | 22.8 GWh | ~7,500 |
*at an average annual consumption of 3,000 kWh per household.
What are full-load hours?
The full-load hours are the calculated hours per year for which the turbine would have to run at full rated power to reach its actual annual yield. They condense wind resource, turbine type and availability into a single figure:
- Coast (SH, MV): 3,500–4,200 h
- Northern Germany inland: 2,800–3,500 h
- Low mountain ranges (Mittelgebirge): 2,300–2,800 h
- Southern Germany low-wind: 2,000–2,500 h
The full-load hours estimator provides a rough estimate for your site.
Why Two Equally Sized Turbines Deliver Different Amounts
Rated power alone says little about annual yield. Two turbines with an identical 6 MW rated power can differ in annual yield by 50 percent or more — the reason lies in rotor diameter and hub height. Because the power contained in the wind grows with the cube of wind speed and with the swept rotor area, a turbine with a larger rotor and taller tower harvests significantly more energy for the same generator output. That is exactly the principle behind modern low-wind turbines: a large rotor on a tall tower paired with a comparatively small generator delivers the highest full-load hours at weaker-wind inland sites.
Hub height also matters through the wind profile: near the ground, forests, hills and buildings slow the wind down, while wind speed increases with height. Every additional metre of tower height therefore taps into more energy-rich air layers — a key reason why repowering turbines with hub heights of 160 to 180 metres are economically viable at sites where old 100-metre turbines barely paid off.
From Theoretical to Actual Generation
The formula rated power × full-load hours gives a reliable annual figure, but actual generation fluctuates strongly over the year: during the windier winter half of the year, an onshore turbine in Germany typically generates significantly more than in summer — unlike solar, which peaks in summer. This complementary pattern makes combining both technologies attractive for a more even supply. For an initial site-based estimate of full-load hours and yield, the full-load hours estimator and the repowering yield tool help; the LCOE calculator provides the economic context.
How an Operator Estimates Yield Before Construction
Before an investment decision, developers commission a yield assessment: wind measurements or modelling at the planned site are combined with the technical parameters of the intended turbine type to produce a probability distribution of annual yield. The common reference values are P50 (the statistically expected average) and P90 (the value that is met or exceeded with 90 percent probability) — the latter forms the more conservative basis for bank financing, because it prices in the risk of a weaker wind year more heavily. This forecast uncertainty is also why the same turbine type at the same site can show slightly different yield figures across different assessments.
Why Yield Does Not Stay Constant Over 20 to 25 Operating Years
Annual yield does not only fluctuate year to year due to weather, it also changes systematically, if slightly, over the turbine's operating life. In the first years of operation, technical availability is typically at its highest, while towards the end of the service life scheduled maintenance intervals and age-related wear on components such as rotor blades or gearboxes (where fitted) can slightly reduce yield. Soiling of the rotor blades from insects or weather effects also plays a role and is therefore regularly addressed through cleaning and maintenance. Economic models account for this gradual decline over the operating life as a degradation factor.
Why Wind Speed Is the Decisive but Uncertain Variable
Because the power contained in the wind grows with the cube of wind speed, a seemingly small deviation in average wind speed has a disproportionately large effect on annual yield: a 10 percent higher average wind speed can, in calculation terms, mean well over 10 percent additional yield, as long as the turbine is not already operating in its rated power range. This explains why site selection and careful, multi-year wind measurement matter more for a wind turbine's economics than small technical differences between turbine types from the same manufacturer.
Frequently asked questions
How many households does a wind turbine supply?
A modern 6 MW turbine supplies, on a calculated basis, 5,000–7,000 households. Because wind does not blow constantly, this is an annual average, not continuous supply.
How much CO₂ does a wind turbine save?
For each kWh produced, roughly 400–600 g of CO₂ are avoided compared with the German electricity mix. An 18 GWh turbine therefore saves about 7,000–11,000 tonnes of CO₂ per year.
Does a wind turbine run around the clock?
No — only when there is enough wind. The onshore capacity factor is 25–40 %, meaning the turbine produces on average 25–40 % of its theoretical maximum output.
Why does a modern turbine produce so much more than a 20-year-old one?
Because both installed capacity and full-load hours increase: larger rotors and taller towers raise full-load hours, while a single modern turbine also has a multiple of the rated power of an old one. As a result, a single new turbine often replaces the yield of several old turbines during repowering — using fewer sites.
What is the difference between full-load hours and capacity factor?
Both describe the same thing. Full-load hours divided by the 8,760 hours in a year give the capacity factor. 3,000 full-load hours therefore correspond to roughly 34 percent capacity factor.
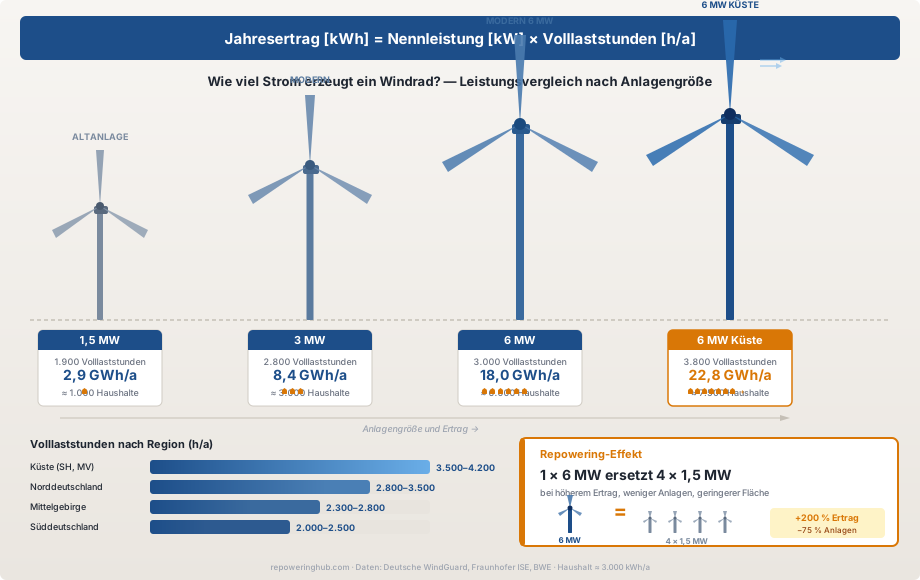
Power output by turbine size – rated power, full-load hours and households supplied