Acoustic Emission Prognosis for Wind Turbines
The acoustic emission prognosis (Schallimmissionsprognose) calculates how loud the planned turbines will be at the nearest residential buildings — predictively, before construction. It is the mandatory noise calculation for every BImSchG permitting procedure and the basis for assessment under the TA Lärm (Technical Instructions on Noise).
What does it contain?
- Source data of the turbines: sound power level LWA in dB(A) from manufacturer measurements per FGW TR 1 / IEC 61400-11, incl. octave spectrum and ±2σ safety margin
- Immission points: location and protection status of all relevant residential buildings (general residential area, mixed-use area, village area, etc.)
- Propagation calculation per DIN ISO 9613-2 (alternative point-source models of the LAI), accounting for reflection, ground absorption, and weather
- Level summation for multiple WTGs and pre-existing noise from other sources
- Comparison with TA Lärm thresholds day/night
- If thresholds are exceeded: proposed mitigation measures (noise-reduced night mode)
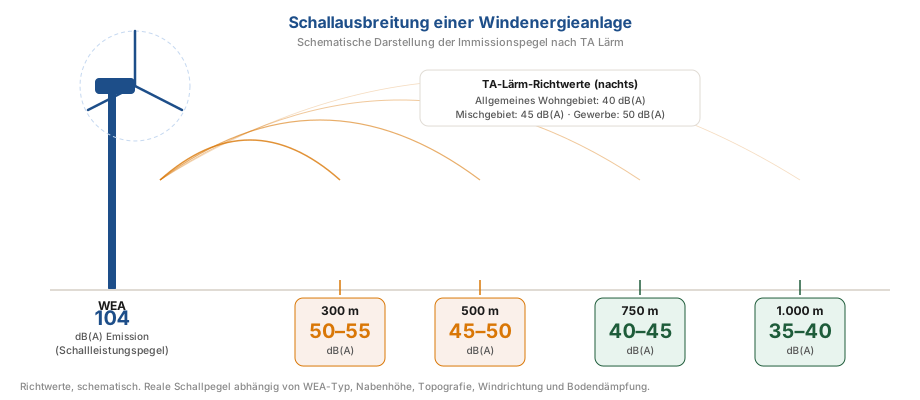
Schematic sound propagation from a WTG — immission levels by distance (guideline values)
Sound power levels compared (guideline values)
| Turbine class | LWA full load | Night mode (typical) |
|---|---|---|
| 2 MW turbines (legacy) | 103–105 dB(A) | 99–101 dB(A) |
| 3–4 MW class | 104–107 dB(A) | 100–103 dB(A) |
| 5–7 MW class | 105–109 dB(A) | 101–105 dB(A) |
| Modern low-wind turbines with "quiet mode" | 104–106 dB(A) | 96–100 dB(A) |
How DIN ISO 9613-2 calculates — the attenuation terms
The core of the prognosis is the propagation attenuation between the sound source (nacelle) and the immission point. DIN ISO 9613-2 derives the immission level from the sound power level LWA minus a sum of attenuation terms, calculated octave by octave (63 Hz to 8 kHz):
- Geometric divergence (Adiv): the dominant term. For a point source, the level falls by roughly 6 dB per doubling of distance. This accounts for most of the level reduction between the nacelle and the residential building.
- Atmospheric absorption (Aatm): frequency-dependent, markedly stronger in the higher octaves. It depends on temperature and humidity; the standard specifies coefficients per octave band.
- Ground attenuation (Agr): depends on ground properties (hard/porous) and the height geometry. At high hub heights and with downwind propagation, it is conservatively assumed to be small.
- Screening (Abar): from terrain edges, embankments, or buildings. For WTGs in open terrain, usually negligible.
Because the standard assumes downwind conditions (worst case) for the relevant times, the result is systematically on the safe side. That is exactly what makes it acceptable to authorities: the prognosis tends to overstate rather than understate the actual noise level.
Process — from turbine data sheet to report
- Obtain turbine data: measured sound power levels (FGW TR 1 / IEC 61400-11) including octave spectrum and series scatter, for full load and every noise mode.
- Define immission points: the relevant windows of rooms requiring protection under TA Lärm, 0.5 m in front of the façade, with area classification.
- Build the model: turbine coordinates, hub heights, terrain model, ground factor. Pre-existing noise from other sources is added.
- Calculation and level summation: energetic sum of all WTGs per immission point, compared against the night-time threshold.
- Mode variation: if full-load operation exceeds the threshold, the quietest still-permissible operating mode per turbine is identified.
- Report: input data, calculation assumptions, results table per immission point, and the resulting operating restriction.
Repowering: what changes compared to the existing site
In repowering, a few large turbines replace many small ones. The new turbine has a higher absolute sound power level, but is often positioned further from residential buildings and has graduated, certified noise modes. For the prognosis, only the result at the immission point counts — not the source level. Careful siting and a night mode frequently keep the site within the night-time threshold even though the individual turbine is louder. The operating mode derived by the prognosis later becomes an ancillary condition of the permit.
What does an acoustic emission prognosis cost?
Guideline value EUR 5,000 – 20,000 for a wind farm with 3–6 turbines. For high complexity (many immission points, high pre-existing noise, development of a mitigation concept) up to EUR 25,000. For repowering projects, the effort is often lower because the geometry of the existing turbines is similar.
Who may prepare the report?
Only measurement bodies accredited under § 29b BImSchG or accredited acoustics engineering firms (DIN EN ISO/IEC 17025). Established providers in the onshore WTG sector include: Deutsche WindGuard, TÜV Sued, ITAP, Wölfel, KOETTER, Müller-BBM and various regional acoustics offices.
Acoustic emission prognosis for your wind farm
We forward your enquiry to an accredited acoustics engineering firm and obtain a quotation — tailored to turbine count, site, and permitting stage.
Request a quoteFrequently asked questions
What is the difference to a sound protection report?
The sound protection report is the extended document that, in addition to the prognosis, describes a concrete mitigation concept (measures, proof of effectiveness). In practice, both are often delivered in the same document.
How accurate are the prognoses?
Very accurate — real-world measurements typically come in 0.5–2 dB below the prognosis because the model calculates conservatively. Authorities accept DIN ISO 9613-2 without dispute.
What about infrasound?
Infrasound is not covered by standard prognoses under TA Lärm (frequency range > 16 Hz). For low-frequency components (8–100 Hz) there are special reports per DIN 45680, which are rarely required in practice.
How does the prognosis handle several planned turbines at once?
It calculates all turbines in the wind farm together and adds the individual contributions energetically at each immission point — not linearly, but logarithmically per DIN ISO 9613-2. Pre-existing noise from other sources in the surrounding area is factored in as well. The result is the governing total level against which the immission threshold is checked — not the isolated effect of a single turbine. This is why a larger wind farm does not necessarily perform worse acoustically than a few individual turbines. For site planning, a practical principle follows: the overall arrangement of the turbines relative to each other and to the immission points often influences the result more than the choice of a single, particularly quiet turbine type.