Investment Costs for Wind Turbines
A modern 6 MW onshore turbine costs approximately 1,200–1,700 €/kW turnkey — i.e. 7.2–10.2 million EUR per turbine. Below is the full cost breakdown plus the levers available to optimise CAPEX.
CAPEX Breakdown (Onshore 2026)
| Item | Share of CAPEX | Range €/kW |
|---|---|---|
| Turbine incl. delivery & erection | 55–65% | 700–950 €/kW |
| Foundation + structural engineering | 5–8% | 80–130 €/kW |
| Internal grid connection (transformer, cables) | 5–8% | 70–130 €/kW |
| External grid connection (to grid operator) | 3–8% | 40–130 €/kW |
| Access roads + crane pad | 2–5% | 30–80 €/kW |
| Initial lease payment + rights of way | 1–3% | 15–50 €/kW |
| Expert reports + permitting (BImSchG) | 2–4% | 30–70 €/kW |
| Construction-phase insurance | 0.5–1.5% | 10–25 €/kW |
| Financing ancillary costs | 1–2% | 15–35 €/kW |
| Decommissioning bond | 1–2% | 15–35 €/kW |
| BNK (demand-driven aviation lighting) | 2–4% | 25–70 €/kW |
| Miscellaneous (project management, risk buffer) | 3–7% | 40–120 €/kW |
| Total | 100% | 1,200–1,700 €/kW |
Cost Range — What Drives the Difference?
- Turbine type: low-wind turbines with large rotors cost more per kW than high-wind models
- Site difficulty: forest, slope, peatland add +5–15% compared to flat terrain
- Grid connection distance: 5 km of new cable route costs 200,000–400,000 €
- Lease structures: multiple landowners = higher initial fees
- Economies of scale: from 5+ turbines per wind farm −5 to −10%
- Turbine delivery schedule: 2026 market is tight, prices at the upper end of the spectrum
Repowering Cost Savings
When repowering, parts of the CAPEX are reduced because infrastructure already exists:
| Item | Greenfield | Repowering |
|---|---|---|
| Access roads | 30–80 €/kW | 5–25 €/kW (adaptation) |
| External grid connection | 40–130 €/kW | 10–60 €/kW (reinforcement) |
| Initial lease | 15–50 €/kW | 5–20 €/kW (extension) |
| Permitting (BImSchG) | 30–70 €/kW | 20–60 €/kW (partially reusable) |
| Total savings | — | 50–140 €/kW |
Plus: decommissioning costs for the old turbines (50,000–200,000 € per turbine) must be factored in depending on the accounting approach — see Decommissioning (DE).
Financing Structure
- Equity 20–30%: from sponsor, investor, or community wind participation
- Debt 70–80%: banks (NORD/LB, KfW IPEX, Triodos, regional savings banks, international energy lenders)
- Debt interest rate: approximately 4–5% p.a. in 2026, depending on creditworthiness + collateral
- Debt tenor: 15 years standard, some up to 18 years
Procurement Strategy: EPC Contract versus Multi-Contracting
When awarding construction work, two fundamentally different models exist, and they have a noticeable effect on risk allocation and CAPEX:
- EPC contract (Engineering, Procurement, Construction): a general contractor takes on planning, procurement and construction turnkey at a fixed price. Advantage: clear accountability, a single point of contact, lower interface risk. Disadvantage: the general contractor typically builds in a risk premium of 3–8% on the individual trades.
- Multi-contracting: the operator awards turbine supply, foundation, grid connection and access roads separately to individual contractors. This offers potential for lower CAPEX (the general contractor's margin disappears), but the operator carries the interface risk between trades themselves — for example if foundation work is delayed and this creates standstill costs for the turbine supplier.
In practice, smaller project developers often choose EPC for the planning certainty it provides, while experienced portfolio holders with their own project management save costs through multi-contracting. As a rule of thumb, the CAPEX difference between the two models is 3–7%.
Risk Buffers and Cost Overruns in Practice
Even with careful planning, cost overruns against the original budget occur. Typical causes from project practice:
| Cause | Typical extra cost |
|---|---|
| Ground condition surprises (worse subsoil than initially assumed) | 2–8% of foundation costs |
| Delay from legal challenges against the permit | indirect: higher financing ancillary costs from a longer construction period |
| Component supply bottlenecks (transformer, cables) | 5–15% on the affected item |
| Subsequent conditions attached to the permit (e.g. retrofitted noise mitigation) | 10,000–50,000 € per turbine |
A common risk buffer in CAPEX budgeting is 5–10% of total investment — it is already included proportionally within the "miscellaneous" item in the table above, but should be shown as an explicit separate reserve line in bank financing models.
Regional Cost Differences in Germany
Beyond site difficulty in the narrower sense (forest, slope, peatland), regional cost differences also arise from local construction capacity and grid infrastructure:
- Northern German coastal regions: well-developed wind supply industry, shorter transport routes for rotor blades from the port — tends to mean lower logistics costs.
- Southern German low-mountain regions: more elaborate access road construction due to gradients and curve radii for heavy transport, sometimes requiring special transport permits with several weeks' lead time.
- Grid expansion-constrained areas (parts of northern Germany): capped build-out capacity limits how much new capacity can be added, but does not directly affect CAPEX per turbine — it affects the volume of auction awards that can actually be realised.
For a reliable cost estimate, a regional quote comparison with at least two to three EPC or individual-trade providers is always advisable.
It is also worth looking at the procurement practices of local access-road and civil engineering firms: in regions with high construction activity (parallel wind farms, infrastructure projects), civil engineering capacity is often fully booked, which drives up waiting times and quoted prices. An early request to several regional providers — ideally in parallel with the permitting phase — helps identify capacity bottlenecks in time and factor them into the schedule.
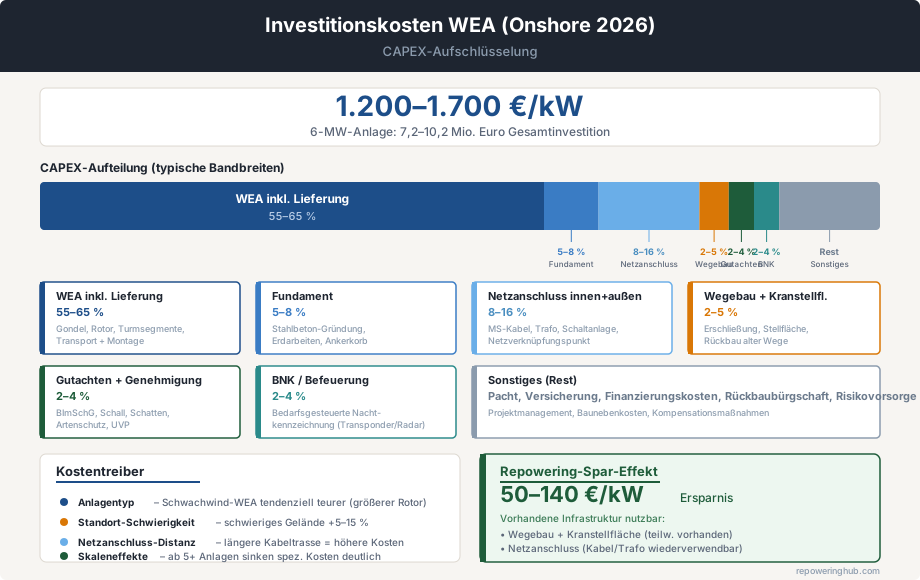
Onshore wind CAPEX (2026) — cost breakdown, cost drivers and repowering savings
Detailed CAPEX Calculation for Your Project?
We connect you with an energy finance consultant — full CAPEX model including manufacturer bid comparison and financing concept.
Request a QuoteHow Investment Costs Shift Over a Project's Lead Time
The cost ranges quoted here are a snapshot — turbine prices, steel and copper costs, and freight rates fluctuate noticeably over a project's multi-year lead time. Anyone who obtains a price quote early in the planning process should therefore not simply assume that the quote will still hold by the time construction actually begins — many supply contracts include price-adjustment clauses that pass on a share of raw material price swings to the buyer.
Frequently Asked Questions
Why such a wide range of 1,200–1,700 €/kW?
Site difficulty + turbine size + economies of scale. A single 6 MW turbine on a forest site can cost 1,700 €/kW, while five turbines on flat terrain may come in at 1,300 €/kW.
When should turbines be ordered?
In 2026, allow 12–18 months lead time. Some projects place orders before BImSchG (Federal Immission Control Act) permit approval using an option contract — this protects against delays in commissioning.
Are maintenance contracts included in CAPEX?
No — maintenance is OPEX, not CAPEX. A full-service contract with the manufacturer typically runs 10–15 years at 8–12 €/MWh — see OPEX.
EPC or multi-contracting — which fits a single project?
For first-time projects without in-house construction project management, EPC is usually the more pragmatic route — the planning certainty justifies the premium. With multiple turbines in a portfolio and existing internal expertise, multi-contracting can noticeably reduce CAPEX.
How does a ground survey affect CAPEX accuracy?
An early geotechnical survey significantly reduces the risk of later foundation cost overruns — it typically costs a few thousand euros per site but can prevent five-figure change orders. It should be available before the final CAPEX calculation, not only during construction.