Yield & Yield Assessment
The expected annual energy production (AEP) is the key figure in any wind farm financing. Bankable yield assessments follow the FGW Technical Guideline 6 (TR6) and quantify uncertainties as P50/P75/P90 exceedance probabilities. We explain the methodology, measurement procedures, wake losses and new optimization approaches (AI / wake steering).
Sources: FGW e.V., TÜV Nord, DNV.
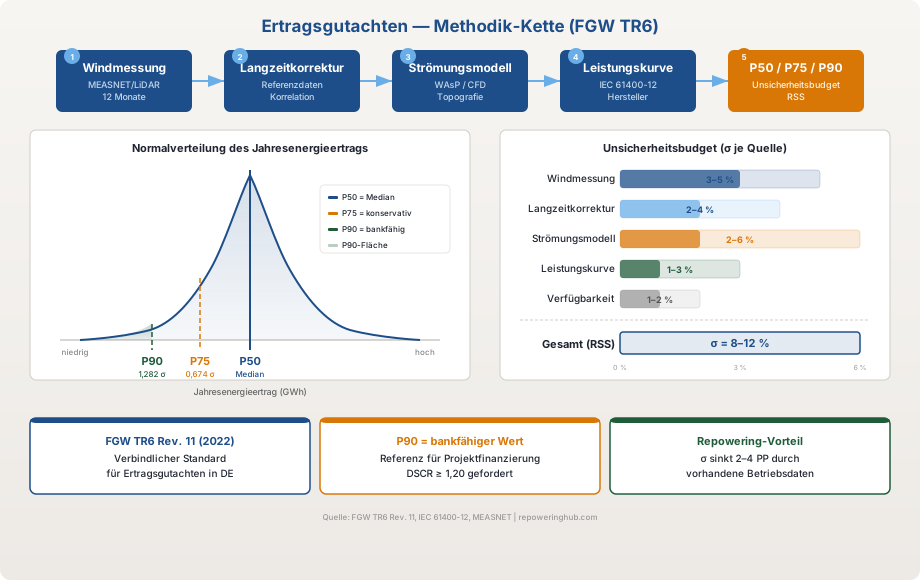
Yield assessment — methodology chain, uncertainty budget and P-values (FGW TR6)
Looking for a yield assessment or layout optimization?
Do you need a bankable yield assessment per FGW TR6, a wind measurement or a layout optimization for your wind farm project? We connect you with accredited assessors and specialized planning offices.
Make an enquiryMethodology & YMYL note
Yield assessments are the basis for multi-million-euro investment decisions. We provide no yield forecasts of our own; instead, we explain the methodology. All figures on these pages come from publicly available, citable sources (FGW, DNV, TÜV, Fraunhofer IWES). Caution: frequently cited AI additional-yield figures (12–17%) are best-case values under laboratory conditions — the annual AEP uplift of a real wind farm is considerably lower. Details under AI Yield Optimization.
From Rough Estimate to Bankable Assessment
Yield assessment is not a single step but a chain that gets progressively more rigorous — and more expensive — as a project moves toward financial close. An initial desktop estimate from a public wind atlas costs little and is useful for ruling sites in or out early, but no bank will lend against it. Once a site is worth pursuing, an on-site measurement campaign (LiDAR or met mast) over 12+ months, correlated against long-term reference data (MERRA-2, ERA5), produces the P50/P90 figures that actually underpin a financing decision. Skipping straight from the desktop estimate to construction financing is where most avoidable yield-assessment disputes originate.
Why Repowering Sites Have an Advantage
A site with years of operating history from an existing turbine offers something a greenfield site cannot: verified, multi-year production data instead of a single measurement campaign. That historical yield can be run backward through the power curve to derive a highly reliable site wind speed, then extrapolated to the new, usually taller hub height using the Hellmann power law. In practice this often produces a more defensible P90 figure than a fresh 12-month campaign at an unmeasured site — one reason repowering projects can sometimes secure financing faster than comparable new-build projects.
Why AI Yield-Optimization Claims Need Scrutiny
Marketing material for wake-steering and AI-based turbine control frequently cites additional-yield figures in the 12–17% range. Those numbers typically come from controlled test-site conditions or simulation studies, not from a full year of operation across a real, heterogeneous wind farm with variable wind directions and turbine ages. A prudent approach treats these figures as an upper bound and applies a substantial discount when building a business case — the realistic uplift for an existing park is usually a low single-digit percentage, and any financing model relying on the higher end of the marketed range should be treated with caution.
When to Commission a Yield Assessment
A desktop yield estimate is enough for an early site screen, but any binding financing decision — bank loan, PPA negotiation, or investor commitment — requires an FGW TR6-compliant assessment prepared by an accredited provider. Commissioning it too late in the process is a common cause of delay: the underlying wind measurement campaign alone can take 12 months or more, so it needs to start as soon as a site is worth pursuing seriously, not once financing documents are already being drafted.
Key terms
| Term | Meaning |
|---|---|
| FGW TR6 | Technical Guideline 6 of the Fördergesellschaft Windenergie (German wind energy promotion association) — the standard for yield assessments in Germany |
| MEASNET | International association for wind-measurement quality assurance |
| P50 | Energy yield exceeded with a 50% probability (median expectation) |
| P90 | Energy yield exceeded with a 90% probability (conservative, used by banks) |
| Wake losses | Yield reduction caused by wake turbulence from upstream turbines |
| Array efficiency | Ratio of actual wind farm yield to the sum of individual turbine yields without interaction |
| Wake steering | Deliberate yaw movement of the upstream turbine to deflect its wake |